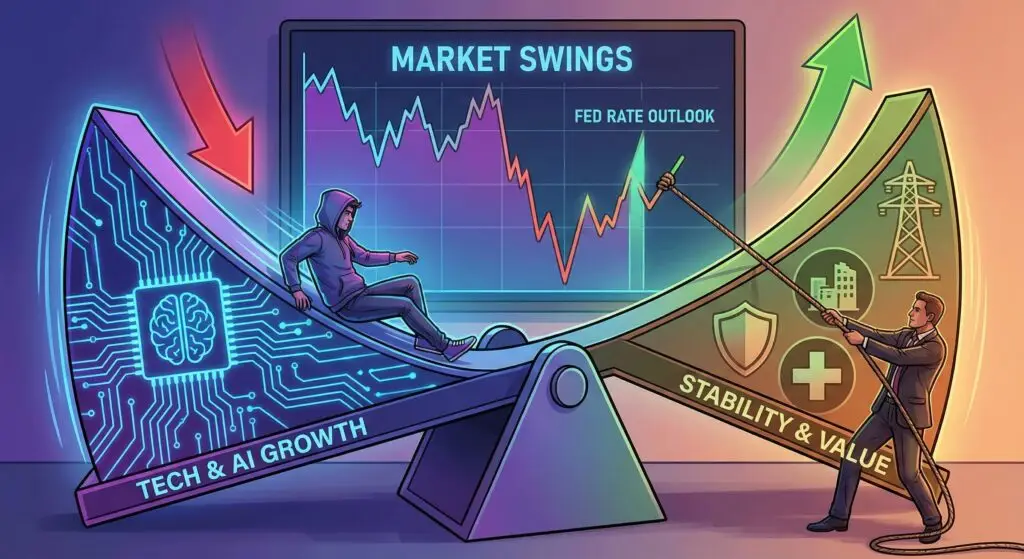
This week delivered another round of sharp 1% to 2% moves, and Thursday was the clearest example. The Nasdaq opened up 2% and closed down more than 2%. You almost never see a 4% to 5% swing in a single session unless the market is dealing with real stress. We saw it during the pandemic crash and the 2008 crisis, not during normal pullbacks. It usually means money is rotating. Investors take profits from the big winners and move toward stability in healthcare, utilities, and higher quality value names. This latest move is part of a broader AI correction across risk assets. Everything tied to that theme is repricing as investors reconsider the speed and cost of the AI build out. The long term AI story remains solid. This is a price correction, not a fundamental one. Alphabet’s release of Gemini 3 is a reminder of how fast the innovation cycle is moving.
Gemini 3 set new benchmarks in reasoning and multimodal capability and was trained entirely on Google’s proprietary Tensor Processing Units. This gives Google a full stack advantage and independence from NVIDIA chips. The strong reviews helped push Alphabet’s stock up more than 4% for the week.
Crypto and Asset Volatility
Other risk assets corrected and then rebounded, and cryptocurrencies followed the same pattern. Many major coins are down over 20% from recent highs, which fits the usual crypto cycle. Sharp drops are part of its normal behavior, and it often finds support quickly before the next leg higher. For investors who missed Bitcoin, this is a rare chance to buy below the previous peak.
Interest Rates and Capital Flows
The surge in volatility is tied to rapidly shifting expectations for a Federal Reserve rate cut. When a Fed governor made a dovish comment yesterday, the probability of a near term cut jumped from about 35% to almost 70% according to the CME FedWatch tool. Markets rallied instantly. It shows how sensitive stocks are to even subtle moves in interest rate expectations.
Dividend stocks and long duration assets rally when rates fall because a lower discount rate increases the value of future earnings. That creates urgency. Money market funds now hold more than $6.5 trillion. When short term rates fall, a large portion of that cash will move into risk assets to seek better returns. Trading systems are already anticipating this shift.
The AI Economic Transition
The economic upside from AI remains enormous. It can add trillions of dollars to global GDP through productivity gains. But the transition is difficult in the near term. Generative AI automates knowledge work, targeting white collar roles that were once considered secure. The technology is replacing tasks faster than the economy can retrain workers, creating a temporary imbalance that pressures wages and hiring. Goldman Sachs estimates that about two thirds of jobs in the United States and Europe have some level of exposure to AI automation.
The cost of the AI arms race is another major factor. Many tech companies have taken on billions in new debt to build data centers and secure long term access to chips and power. Oracle is the most aggressive example. They announced a $38 billion debt plan to expand their data centers. Credit markets reacted quickly. The cost to insure Oracle’s five year debt more than doubled, rising from about 55 basis points to more than 100 basis points. This reflects hedging activity, not a bankruptcy threat. Oracle remains investment grade, and this is a strategic investment needed to compete in AI. The spike mostly shows how nervous credit traders are.
Rotations and Strategy
Even with the big swings, the underlying market is stable. The stocks that ran the hardest corrected, and most higher quality names barely moved. What has changed since 2020 is the speed of these rotations. Value rallies for a day or two when long term rates fall, then money quickly returns to the largest technology companies. Leadership never lasts because the companies with real earnings growth are still the AI related names. A small move in rates or a slight change in Fed language triggers trading systems and large funds, and that pulls the entire market with it.
NVIDIA is the clearest example of the rotation. Everyone wants to own it because they know where the future is heading, but few want to overpay. When NVIDIA sells off, investors immediately rotate out of stability names like Berkshire Hathaway to buy the dip. The fact that Berkshire often trades in the opposite direction as NVIDIA on any given day shows just how powerful the AI theme has become. For a fun exercise, I asked AI if what I have seen in this correlation is true over the last 3 months. It wrote back to me, “Your observation that Berkshire now trades off what Nvidia does is technically supported by a weak negative correlation—a value of -0.0811 driven by tactical investor rotation between the high-growth ($NVDA$) and stability/value ($BRK.B$) trade.” But having watched these day-to-day moves, I’ll disagree with the AI and continue to think the magnitude of this rotation is much greater than the weak correlation suggests. 🙂
This is precisely why traditional rotation strategies have been so difficult. The window of leadership is now measured in days, not months. The better approach is to stay balanced, avoid reacting to every headline, and use the volatility to add to high quality names when they briefly fall out of favor. I expect the Federal Reserve will eventually cut rates next year, particularly as President Trump gains more influence over the central bank. Diversification is key to managing through all these rotations, because it’s best to always have a blend of both quality and growth in your portfolio. I’ll let you know the moment we see a real break in the volatility and the day-to-day noise starts to quiet down.
Have a great weekend!
Sources
1. Nasdaq Composite Index Data (Intraday volatility).
2. Alphabet Inc. (Class A) Stock Performance.
3. Cryptocurrency Market Data (Major coin drawdowns).
4. CME Group. (2025). FedWatch Tool – Interest Rate Probabilities.
5. Investment Company Institute (ICI). (2025). Money Market Fund Assets Data.
6. Goldman Sachs. (2025). Research on AI Labor Market Exposure.
7. Oracle Corporation. (2025). Debt Issuance & Capital Expenditure Announcements.
8. Credit Market Data (Oracle 5-Year CDS Spreads).
9. Market Data Analysis (NVDA vs. BRK.B Correlation Coefficient).
Disclaimer
The information provided in this communication is for informational purposes only and does not constitute financial, investment, or legal advice. All content is based on data and sources believed to be reliable, but accuracy and completeness cannot be guaranteed. Market conditions and economic factors are subject to rapid change. Past performance is not indicative of future results. The views expressed herein are those of the author and do not necessarily reflect the official policy or position of any other agency, organization, employer, or company. Investors should conduct their own research and consult with a qualified financial advisor before making any investment decisions. The author may hold positions in securities mentioned in this post.