Fear, Flows, and the AI Spending Race
PRIVATE WEALTH Weekly Update: Fear, Flows, and the AI Spending Race February 7th, 2026 This week was one of the most volatile in recent memory,
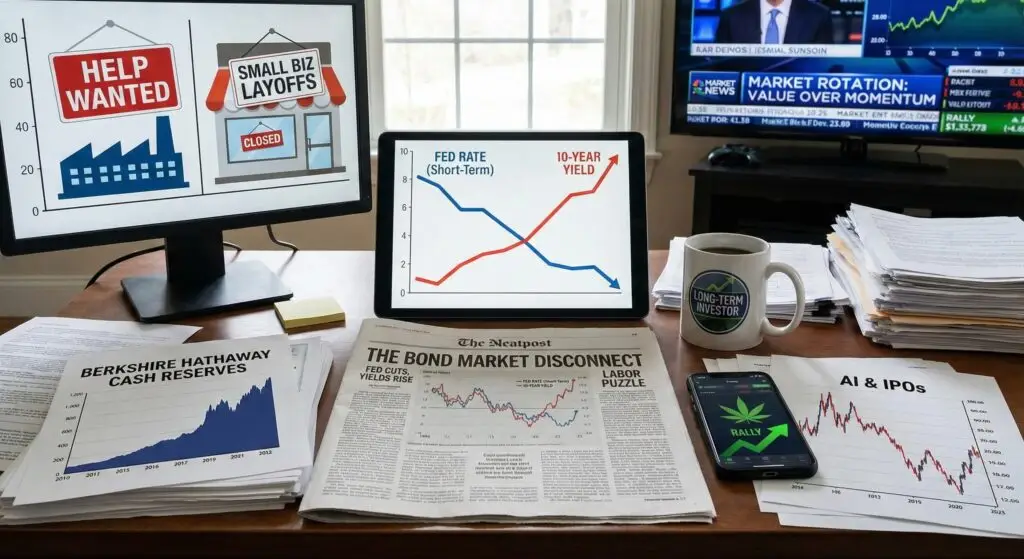

This week, the Federal Reserve cut its benchmark rate by another 0.25%, bringing the target range to 3.50%–3.75%. That marked the third consecutive meeting with a rate cut and reinforced what is now a clear pivot toward easier policy. In addition, the Fed announced plans to purchase roughly $40 billion of short-term Treasuries to add liquidity to the banking system. None of this came as a surprise. The direction of policy is well established, and rate cuts are likely to continue into next year as the Fed attempts to get ahead of slowing growth rather than react after the fact.
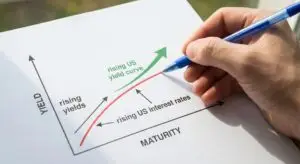
What did catch investors off guard was the bond market’s response. While short-term rates moved lower in line with Fed policy, the 10-year Treasury yield moved higher, rising from roughly 4.00% to around 4.20%. This was not a signal of renewed optimism about economic growth. Instead, it reflected hesitation from bond investors to lock money up for long periods of time. Inflation has come down, but uncertainty remains elevated. A likely reason is that government borrowing continues to add to overall debt levels, and lenders are demanding a higher return to commit capital for a decade or more. In short, investors are comfortable owning short-term bonds where flexibility is preserved, but they want to be paid more to take duration risk.
This dynamic helps explain why the economy can feel like it is moving at two speeds at once. Policy is easing, but financial conditions are not loosening evenly across the system. Short-term financing has become more accessible, while longer-term borrowing remains relatively expensive. The impact will be felt most by smaller businesses that rely more heavily on bank lending and variable-rate financing rather than deep capital markets. There always seems to be something happening that tests investor confidence, and this environment is no different.
The labor market is telling a similarly mixed story. Job openings have ticked higher, yet hiring has slowed and smaller businesses are quietly reducing headcount. The most recent ADP report showed small businesses cutting more than 100,000 jobs last month. At first glance, rising job openings alongside falling employment appears contradictory, but the reality is more nuanced. Many large companies continue to keep job postings open even if they are not actively hiring, either to preserve flexibility or to collect resumes.
Complicating matters further, recent government shutdowns and delayed reporting have distorted some of the economic data. Chairman Powell acknowledged during his press conference that certain reports may contain quality issues or lag real-time conditions. The Bureau of Labor Statistics is now working through a backlog and is expected to release delayed employment data in the coming week. Even so, markets continue to react aggressively to each release, often moving 1%–2% on numbers that may later be revised. When visibility is limited and positioning is crowded, investors tend to react first and analyze later. Even when the data is imperfect, it still drives short-term market psychology.
Within equity markets, this uncertainty has translated into higher volatility and a clear rotation beneath the surface. Market leadership has quietly shifted away from pure momentum-driven trades and toward companies that benefit from a widening yield curve. Banks, in particular, tend to thrive in this environment. They borrow at short-term rates and lend at longer-term rates, and when that spread widens, profitability improves. That dynamic helps explain why financials have led the recent rally. If the economy holds together and yield spreads remain wide, financials should remain a leadership group.
On the other hand, several high-profile AI-related stocks have pulled back in recent weeks, not because the long-term opportunity has disappeared, but because valuations had become stretched and expectations were high. Oracle is a good example. Shares declined after the company announced a significant increase in capital spending, with expectations of roughly $50 billion in investment by fiscal 2026. That level of spending signals confidence in long-term AI demand, but it also raised concerns about near-term margins and cash flow. In this environment, the market is less willing to pay for distant promises and more focused on execution, balance sheet strength, and cash generation. This is a meaningful shift from earlier this summer, when momentum trading dominated and fundamentals took a back seat. Even utilities, which had been among the strongest-performing sectors earlier in the year, have sold off and are now trading at much more reasonable valuations. They represent one of the few pockets of the market that does not appear overextended.
From a portfolio perspective, periods like this tend to reward long-term investing. Daily volatility in individual stocks has become extreme, with moves of 5% or more occurring on little to no material news. Chubb, for example, fell more than $10 in a single day and then gained roughly the same amount the following day. This is not a normal trading pattern. It suggests thinner liquidity is allowing traders to move prices. I noticed these patterns while following stock prices closely and was curious whether anything had been written on the topic. Gemini 3 referenced a classic paper titled “Do Retail Traders Move Markets?” As expected, the key insight was that even though individual orders are small, when they synchronize, they create a massive order imbalance. This imbalance can move stock prices significantly, independent of any new fundamental information.
My conclusion is that we are living in a period where retail investors can push stocks higher, abandon them, and quickly move on to the next trade. One way to test this theory is to look at IPOs in 2025. I asked AI whether most IPOs were down more than 30% this year, and it confirmed that many have struggled significantly. I already knew this, having seen a CNBC chart showing that many of this year’s most anticipated IPOs are now negative. A few were up more than 50% earlier in the year, only to be down 30% or more now. AI cited examples such as Bullish Global and Chime Financial. I initially expected Circle Internet Group, which traded as high as $300 and is now closer to $83, but I was wrong because its IPO price was $31 and the stock is still more than double that level. The more interesting question is who bought at $250 or higher and is now sitting on significant losses. There are still the “early birds” who entered at the IPO price, but many others were not so fortunate.
That said, leadership can change quickly. Retail investors tend to move on to the next hot stock. Yesterday, it was cannabis stocks’ turn. Cannabis stocks rallied sharply following reports that the Trump administration is preparing to reclassify marijuana from a Schedule I to a Schedule III controlled substance. This potential regulatory shift would remove the punitive Section 280E tax provision, which currently prevents cannabis companies from deducting standard business expenses. Investors reacted positively to the prospect of improved cash flows, reduced tax burdens, and potentially easier access to traditional banking services, driving names like Tilray up 44% and Canopy Growth up 53%. These stocks had been left for dead, only to reemerge like zombies. The compounding math is always interesting. Canopy was up 53% in a single day but remains down roughly 46% over the past year. The largest gains often occur off the bottom. I don’t need AI to confirm this one for me. 🙂
Looking ahead, if growth stocks become sufficiently cheap, capital will rotate out of value and back into growth, just as it has repeatedly over the past several years. The best long-term investments are rarely pure value or pure growth. They tend to be reasonably priced businesses with real, durable growth. Because there are relatively few opportunities that truly meet that standard, capital often gets whipped from one area of the market to another by algorithms and short-term traders reacting to headlines rather than fundamentals.
I expect upcoming economic releases to produce some extreme data points that the market will struggle to interpret. If you read carefully between the lines of what Chairman Powell has said, even the Fed recognizes that parts of the data are noisy and imperfect. Markets, however, now react instantly to headlines, especially with AI-driven trading systems moving prices before investors have time to digest the full picture. You do not need perfect data to see that the economy is slowing gradually rather than breaking. At the same time, AI is clearly disrupting parts of the job market, policy is easing, long-term yields are not fully cooperating, and investors are becoming more valuation-aware. That combination tends to favor diversified investors who stay focused on fundamentals rather than short-term narratives. Staying invested, remaining flexible, and allowing time to work continues to be the most reliable way to navigate environments like this and take advantage of opportunities as they emerge.
From a valuation standpoint, I do not see many true bargains today outside of Berkshire Hathaway, which continues to trade at a persistent discount. Berkshire’s cash balance started 2024 at roughly $334 billion and has since grown to about $382 billion, an increase of nearly $48 billion. When you look across the Magnificent Seven, most companies have not meaningfully increased net cash once debt, buybacks, and acquisitions are considered. In fact, several are flat or lower. You would not know this by looking at stock prices, but Berkshire has quietly been the strongest company in terms of pure cash accumulation. Nvidia deserves recognition as well, having increased cash by roughly $14 billion, although much of that was offset by reinvestment, acquisitions, and buybacks. From a free cash flow perspective, Nvidia is growing at a remarkable pace and could exceed $100 billion in annual free cash flow over the next year.
That boom will eventually slow. The largest technology companies cannot indefinitely rely on taking on debt and accelerating capital spending to drive growth. Berkshire, by contrast, represents something increasingly rare in today’s market. If you tune out the noise and focus on future return potential, it is not unreasonable to envision Berkshire’s cash balance approaching $460 billion over the next few years. That level of financial flexibility is becoming an anomaly. Nvidia is the closest peer, but beyond that, there are very few companies with anything close to $150 billion in cash. At that scale, the power of compounding becomes extraordinary. In theory, Berkshire could invest that cash in long-term Treasuries and generate roughly $18 billion a year in income with minimal operational risk. The challenge, of course, is that as short-term rates eventually fall, returns on cash will compress, which helps explain why the stock has lost momentum and appears stuck between being viewed as a compounding machine and being criticized for a lack of near-term growth.
Even so, I expect Berkshire to remain a key contender in this market cycle. That “horse race” can change quickly if major technology companies slow their spending or begin preserving cash rather than deploying it aggressively. If that shift occurs, it could set the stage for meaningful and potentially volatile market moves in 2026. If one were to consider which company is best positioned to grow cash rapidly should Nvidia’s momentum slow, Alphabet stands out. It has the scale, margins, and balance sheet to do so, and is arguably in a leading position in the AI race. At the same time, it also has the most to lose if changes in consumer behavior continue to pressure traditional search. That balance of strength and risk is exactly why valuation and fundamentals matter more than headlines in the period ahead.
Have a great weekend!
1. Federal Reserve. (2025). FOMC Statement & Press Conference. (Rate cut to 3.50%-3.75%; $40B Treasury purchase).
2. U.S. Department of the Treasury. (2025). Daily Treasury Par Yield Curve Rates. (10-year yield rising to ~4.20%).
3. ADP Research Institute. (2025). ADP National Employment Report. (Small business job losses >100k).
4. Barber, B. M., Odean, T., & Zhu, N. (2009). Do Retail Trades Move Markets? The Review of Financial Studies.
5. Bloomberg/CNBC Market Data. (2025). IPO Performance Data. (Bullish Global, Chime Financial, Circle Internet Group).
6. U.S. Dept of Justice / DEA. (2025). News on Rescheduling of Marijuana to Schedule III.
7. Berkshire Hathaway Inc. (2024-2025). Quarterly Reports on Form 10-Q. (Cash balance tracking).
The information provided in this communication is for informational purposes only and does not constitute financial, investment, or legal advice. All content is based on data and sources believed to be reliable, but accuracy and completeness cannot be guaranteed. Market conditions and economic factors are subject to rapid change. Past performance is not indicative of future results. The views expressed herein are those of the author and do not necessarily reflect the official policy or position of any other agency, organization, employer, or company. Investors should conduct their own research and consult with a qualified financial advisor before making any investment decisions. The author may hold positions in securities mentioned in this post.
PRIVATE WEALTH Weekly Update: Fear, Flows, and the AI Spending Race February 7th, 2026 This week was one of the most volatile in recent memory,

PRIVATE WEALTH Weekly Update: Markets Without Anchors: Volatility, Speculation, and the Rise of AI Agents January 31, 2026 This week, the price extremes I wrote

PRIVATE WEALTH Weekly Update: The Escalation Cycle: How Policy and Supply Are Driving Price Extremes January 24th, 2026 This week, markets once again reacted less

PRIVATE WEALTH Policy Shifts and Market Repricing January 17th, 2026 This week, as expected, President Trump’s shift toward affordability continued to shape market behavior. For

PRIVATE WEALTH The “Midterm Mandate” & Policy Intervention January 10th, 2026 This week marked a clear shift in the market narrative. While headlines were dominated
PRIVATE WEALTH Weekly Update: Why the “Wait-and-See” Strategy is About to Get Expensive December 20, 2025 This week was less about surprise and more about
Disclosures
The information presented here is for informational purposes only, and this document is not to be construed as an offer to sell, or the solicitation of an offer to buy, securities. Constant Guidance Financial is not an accounting firm or legal firm; no portion of this content should be construed as legal or accounting advice. Some investments are not suitable for all investors, and there can be no assurance that any investment strategy will be successful. Charts, graphs, and visual illustrations are provided for educational purposes only and should not be relied upon as accurate representations of current market data.
The hyperlinks included in this message provide direct access to other Internet resources, including Web sites. While we believe this information to be from reliable sources, Constant Guidance Financial is not responsible for the accuracy or content of information contained in these sites.
Although we make every effort to ensure these links are accurate, up to date and relevant, we cannot take responsibility for pages maintained by external providers. The views expressed by these external providers on their own Web pages or on external sites they link to are not necessarily those of Constant Guidance Financial.